UC slams the door on standardized admissions tests, nixing any SAT alternative

You didn’t report any information about the grade distribution, so how do you know they are “boosting grades to get kids graduated”. Are you assuming that if a student fails the math/reading proficiency test, they will never graduate from HS?

Math/Reading proficiency measurement criteria varies by state, and I suspect it is often a higher standard than you assume. For example, the state of New Mexico has an overall math proficiency rate of ~20%. The vast majority of New Mexico kids score high enough to get the “math basic” label, but not high enough to get the “math proficient” or “math advanced” labels. These labels correspond their how performance on a common core type test compares to target goals for their grade level. I wouldn’t assume that the ~80% who did not score “math proficient” all should be doomed to never graduate from high school.

That said, many HSs do have special programs that support students graduating, and do not require passing state/national level proficiency type exams to graduate. For example, I attended a basic, public high school in NYS. At the time I attended, there was an abysmal failure rate for math regents – as I recall ~90% failed one of the algebra exams. The number was published in the paper, which led to bad publicity. This resulted in algebra teachers more closely following the regents curriculum, such that the regents pass rate shot up in the following year.

However, students did not need to pass regents to graduate from my HS. There were several different kinds of diplomas. One could get a regents / advanced regents diploma, or one could also get a local diploma. The latter didn’t require any type of state level proficiency exam. There were also special programs for students who were at risk of not graduating due to grades near/at failure, non-academic reasons, disabilities, etc. These programs generally had a single group who attended all the same classes together, which were different classes from typical students, with a higher level of teacher attention and support. I can’t testify to the degree of grade inflation in these classes, but I expect that the key goal was that the students in these special programs graduate HS – not that they have get A’s or have high enough grades for a selective 4-year college.
That is not A high school, that is New Trier school district… they would not be happy with you talking about them being merely A high school district :laughing:

Of course, they are a good example of how affluence can get better ACT scores, including 24% with time accommodations for testing, and kids in this district take the ACT, on average, 3 times.

https://newtriernews.org/news/2018/05/11/testing-accommodations-four-times-national-average/

1 Like

Hey data - thanks for that info. yes, i had assumed that; so i appreciate your take on proficiency rates & graduation.

2 Likes

I was not aware that using SATs in admissions precluded allowing first generation and kids from disadvantaged backgrounds to be admitted to schools.

The anti-test presumption is that a 3.8, 1000 SAT applicant is more deserving of admission than a 3.7, 1500 SAT applicant, all things being equal. I simply can not accept that is a valid way to choose applicants. I do think this will solve itself, because in a TO and test blind world, Superintendents would have to be negligent to not inflate the grades of their high school students. The colleges are practically telling them how to game the system.

The quality of the educational experience is going to suffer for those students that actually want to be in a demanding academic environment, and I expect that those students will eventually gravitate to colleges that select their students based on academic achievement and ability.

My earlier question was why Harvard, Yale, Princeton, Dartmouth and similar all appear to have had record numbers of low/middle SES kids, upon going test optional? This sounds like the opposite relationship of what you imply would occur.

There are certainly many other ways these colleges could boost lower SES enrollment while still requiring scores, including simply increasing the degree of direct boost for being first gen or coming from disadvantaged background. However, there are other relevant considerations, including things like whether the student is likely to be successful at the college. Emphasizing a boost for a hook criteria that is negatively correlated with college success may have a negative impact on such metrics. In contrast, as seen in numerous studies in this thread, going test optional is not associated with a large decrease in metrics like cum GPA or graduation rate. Instead both test submitter and non-submitters usually have similar GPA/grad rate, when admission selectivity is similar for the 2 groups.

Regardless of what theoretically could be done, the typical result upon going test optional at a highly selective need blind college seems to be increased metrics associated with lower SES. This fits with the previously linked studies showing that at test optional colleges, kids who apply and are admitted without submitting scores consistently average lower income than those who submit scores.

The score itself is not critical. What is more critical is whether applicant is academically qualified to be successful at the college, and there are many ways to evaluate that besides SAT scores. If we are still taking about Ivy+ type colleges, admission is based on far more than GPA in isolation + SAT, and because of these additional criteria, I think it is unlikely that many of their test optional admits have a 1000 SAT score.

As an example, Bowdoin has been test optional for more than 50 years. Bowdoin is test optional for admission purposes, but they ask matriculating students to submit scores for reporting purposes in the summer before attending, and report all scores in metrics such as CDS (or at least they did pre-COVID). The 2019-20 (pre-COVID) Bowdoin CDS lists the following SAT score distribution.

Bowdoin Score Distribution
63%: 1400-1600
38%: 1200-1399
7%: 1000-1199
0% <1000

A large portion of the matriculating class at Bowdoin was test optional, yet it appears that nobody (within rounding reporting precision) at Bowdoin had scores as low as your 1000 SAT example. If almost nobody at Bowdoin has scores this low, I don’t think it would be common at Ivies either. The lack of <1000 scores occurs because kids who have top GPA with high course rigor, top LORs, top ECs/awards, top essays, desirable personal/character/motivation traits, … generally don’t bomb the SAT. Some may have scores far lower than might be expected from their application (for example 1300 SAT when 1500+ might be typical for applicants with similar rest of application), but they generally don’t completely bomb the test. The ones that do may have a unique reason such as slow reader due to English being 2nd language, test anxiety, … that doesn’t necessarily mean they will be unsuccessful in college where they will generally be evaluated under different types of metrics that have less time pressure.

Rather than theoretical examples of a low score kid being admitted, most important is how much the SAT score adds to whatever the school is trying to predict beyond this existing criteria. Some of the previously linked studies suggest that SATs predictive value may more be that it is correlated with things like the student attending a HS with a rigorous and quality curriculum than the score itself. So when you consider things beyond GPA in isolation. including rigor of curriculum, the additional predictive benefit from requiring score becomes smaller. The more additional criteria you consider besides GPA in isolation without consider rigor or grading harshness, the less additional benefit score adds to that combination of admission criteria.

This is not the presumption at all. And the rationale has been explained often enough in this thread that I think you know that.

2 Likes

All admission criteria (other than hooks and tips) are, by definition, impediments to admissions, particularly to low-SES applicants. If any one of them, whether it’s standardized testing, essays or ECs, is relaxed or removed, we should expect to see a greater proportion of admits who come from low SES. For example, if a selective college were to remove its essay requirement or make essay optional, wouldn’t we similarly see an increase in low-SES admits?

If we make students less distinguishable from one another by relaxing/removing any criterion, or making the criterion itself less meaningful (e.g. by inflating grades or test scores), we’ll have a student body that is more representative of the population. Logically, the student body will be the most representative if all such criteria are removed.

2 Likes

The increase in the number of students from the lower SES, admitted at HYPD for the class of 2025, is a manifestation of each of these colleges’ institutional goal (pre-determined) to admit more from the lower SES, with or without standardized test scores.

3 Likes

+1000000

" My earlier question was why Harvard, Yale, Princeton, and similar all appear to have had record numbers of low/middle SES kids, upon going test optional?..

There are certainly many other ways these colleges could boost lower SES enrollment while still requiring scores, …

Regardless of what theoretically could be done…"

Data, with all due respect, your pov is more correlation = causation.

Sorry, there is nothing that is theoretical that can be done. The University of California, which this thread is about, has been accepting ~30% Pell Grantees for years, even at the most selective campuses, all while being test-required.

The Ivies – and others of their selectivity – made a business decision not to go after this sub-group of applicants until now. If they had wanted more Pell Grantees in the 90’s, they clearly had the resources to recruit them. Berkeley and UCLA had no problem finding poor kids to apply and succeed, and many of these kids could have thrived at an Ivy if given the chance from them (given the Ivy’s generous financial aid).

So the question for the Ivies, is why now? The Harvard suit? TO due to COVID so it wouldn’t hurt their rankings? Other?

1 Like

That’s not how college admission or selection in general works. When you remove one selection criteria, you replace it with other selection criteria. It does not mean that the selection criteria is replaced with some kind of auto admission.

I’ve repeatedly said throughout this thread that selective admission is not based solely on GPA in isolation + SAT, but for simple example, let’s use a hypothetical college that uses this type of model. Students have to submit something, but students have the choice of submitting only SAT,only GPA, or both, as summarized below:

  • If student submits only GPA, admission is based 100% on GPA
  • If student submits only SAT, admission is based 100% on SAT
  • If student submits both GPA + SAT, admission is based 50% on GPA + 50% on SAT

Which of these 3 groups do you think will have the most low income kids? It isn’t expected to be the one with the least admission criteria. It is expected to be the group for which admission criteria is least correlated with income, and this is the submits only GPA group. Similarly the most high income kids are expected to be in the group for which admission criteria is most correlated with income, which is the submits only SAT group. And this is exactly what has happened at literally every test optional college I am aware of that has compared average income of submitters and non-submitters, which is dozens.

As an example, table 1 of the study at https://files.eric.ed.gov/fulltext/ED502858.pdf lists the following correlations with family income among UC students. SAT was far more correlated with income than HS GPA – different orders of magnitude. If you are skeptical or don’t like the reference, I can list dozens more references that also show SAT score is far more correlated with income than GPA.

Correlation with Family Income
SAT I Verbal – 0.32
SAT I Math – 0.24
HS GPA – 0.04

Among college admission criteria, SAT scores are more correlated with income than just about every criteria I’ve seen compared to it, although I haven’t seen essay compared. Number of AP classes is an exception that may have a similar degree of correlation with income as SAT, and recall that the Ithaca study found that number of AP classes was the evaluated criteria with the highest correlation with SAT score, and had a similar degree of predictive ability as SAT. As touched on any my earlier post, the predictive ability of SAT or # AP classes in isolation may have more to do with correlations with attending a rigorous and quality HS (wealthy kids tend to attend higher quality HSs), rather than something specific to income, although being wealthy enough to pay for 4+ years of college is no doubt correlated with chance of graduating on time.

Another completely different angle that probably played a part in the UCs’ decision:

The College Board is a billion dollar privately held “non-profit”. The test prep industry around it is immensely profitable, as well. It makes its money off of the self-perpetuating angst of students and their families. Its product has at best marginal use in predicting what it is supposed to predict.

Seems to me that universities kicking the tires and deciding they can do without a marginal product is capitalism at work. And if, as it appears, students have one less thing to prep and stress over and pay for, all the better.

And one more “and” - if it turns out the universities need more information, they can figure out how to get it. Either College Board can improve their product, or universities will find another way. The market will provide.

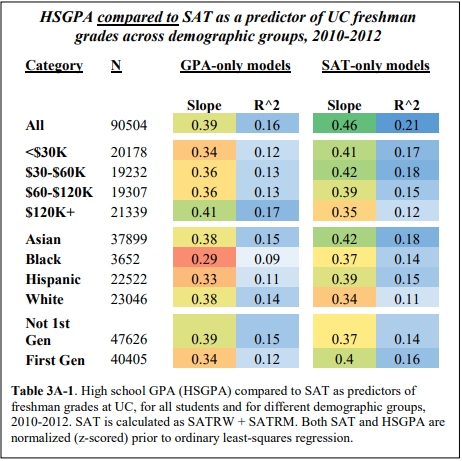
In an earlier post, I quoted from the Standard Testing Task Force (STTF) report to show that at UC, standardized tests were better than HSGPA in terms of predicting various measures of UC student performance.

In this post, I am sharing another part of the report which shows the breakdown of where SAT scores were than HSGPA in terms of predicting UC freshmen grades. The way to read this table is that higher slopes are better, and higher R^2 numbers are better. The SAT scores were better than HSGPA at predicting freshmen year grades for first gen applicants, all income groups except those at $120K+, and all races except for white applicants.
image

There are two key takeaways from this:

  1. As I have long stated, the SAT’s greatest value is in identifying students from poor quality school systems that significantly outperform their peers and are therefore likely to thrive at an elite college. The UC admission system was very good in recognizing this and giving the SAT some weight (but less than HSGPA) in its admission process.
  2. The SAT does not add much predictive value for students from wealthier backgrounds, which is why I suspect there is so much skepticism among the CC crowd.

Now let’s see what this means in terms of graduation rates:

image

There is much more in the report is available here. I particularly recommend it for those that are sceptics of standardized testing. It may change your mind.

2 Likes

That all sounds reasonable. The million dollar question though, is not HSGPA v SAT. It is HSGPA+rigor+essays v SAT+rigor+essays+HSGPA. Does SAT add enough to justify itself?

As an example, the Ithaca study found the following income distribution among test submitters and non-submitters. Test optional applicants, admits, and enrolled all averaged a notably lower income and notably higher Pell %. When the test barrier was removed, more low income + Pell kids applied, more were accepted, and more were enrolled. Many other colleges show exactly the same pattern between test submitters and non-submitters. And this year, many T20 colleges also show the same pattern and are reporting record low income + Pell.

Test optional kids average lower income, and when more of the lower average income kids are admitted, there are more lower average income kids in the full class. Yes, it is not a regression analysis that controls for many variables to clearly separate correlation vs causation (the Ithaca study actually did have a regression analysis, but recent T20 record % Pell / % first gen reports did not), but there is an obvious pattern with a straightforward explanation. To ignore this explanation and suggest it has little to do with going test optional is not a reliable conclusion.

Applicants
Test Submitter Applicants – Mean family contribution = $37k, 10% Pell
Test Optional Applicants – Mean family contribution = $31k, 17% Pell

Admits
Test Submitter Admits-- Mean family contribution = $37k, 15% Pell
Test Optional Admits – Mean family contribution = $30k, 29% Pell

Enrolled
Test Submitter Enrolls-- Mean family contribution = $34k, 18% Pell
Test Optional Enrolls – Mean family contribution = $29k, 30% Pell

Yes, standardized testing is justified according to the academic experts who were asked to create the STTF report, in part due to grade inflation as I wrote in post 314.

I recognize that the UC results run counter to previous studies which show little impact for standardized test scores, but one reason for the difference might be the different time horizon for the study.

The STTF did not have a good control for rigor, which as noted in previous posts is one of most important variables to control for when evaluating the additional benefit of SAT/ACT. This helps separate whether SAT/ACT’s primary benefit is being correlated with the rigor and quality of HS attended, and to a lesser extent grade inflation (3.8 in rigorous curriculum is not same as 3.8 in less rigorous curriculum). One cannot assume that SAT adds a lot of benefit beyond rigor, if one does not have a good control for rigor.

The STTF study also did not recommend keeping the SAT/ACT. While the study found that it had a benefit beyond their controls which were largely GPA in isolation. that does not mean that the recommendation was to keep the SAT/ACT. The authors of the study instead recommended replacing the SAT/ACT with a different “assessment system”, partially due to limited predictive ability among UC students. Note that the variance explained was not high… especially for graduation relation variables, even if it was notably more than GPA in isolation. They did not recommend the recent UC implementation of going test blind for the long term (some did recommend a test blind period in the short term transition period), but they also did not recommend keeping SAT/ACT.

There are a number of contributing factors to the different results from other studies, but a key one is different controls, as noted above. In general studies that have a good control for rigor of either classes or HS attended show a different degree of benefit than those that do not. As an example, the previously linked Allenswirth/Clark study at https://journals.sagepub.com/doi/pdf/10.3102/0013189X20902110 found that ACT of individual student did have a significant correlation with graduation rate beyond income and demographic controls. However, when they also controlled for average ACT of the HS attended, the additional predictive benefit of the individual student’s ACT dropped to ~0. The average ACT of the HS attended was indeed a useful criteria for predicting chance of graduating, but the average ACT of the individual student had ~0 benefit beyond the HS quality/rigor variables. Similarly the Ithaca study that found extremely little additional benefit of SAT/ACT in predicting cumulative GPA beyond existing admission criteria that included controls for both number of AP classes and strength of schedule. If the Ithaca study did not have these rigor controls like the UC study , I expect they would have found a more significant benefit of SAT/ACT beyond measures of GPA in isolation + demographics.

As noted in previous comments, UCs admission policies also contribute. UC has historically weighted GPA much more than SAT, which contributes to an especially restricted range on GPA. If nearly everyone in the class has a top GPA, then slight variations in that top GPA probably aren’t going to be especially predictive. For example, on an UW scale, the difference between a 3.80 vs 3.85 probably isn’t going to be especially predictive. However, if the class has a wider range of GPAs and larger differences among students, then GPA in isolation will be more predictive. UCs historical emphasis on admitting students from a wide variety of HSs that may have less rigorous/quality programs by weighting ELC highly and such also contributes. UC no doubt knows that students who may come from weaker/lower quality HSs may be less prepared, yet they still admit them since UCs have a variety of institutional goals besides just creating the class with the highest possible chance of academic success before effects of a curve. Average SAT/ACT score is no doubt negatively correlated with such students from weaker HS backgrounds.

1 Like

@CTDad-classof2022, since going test optional then test blind, UC has also seen an increase in admission numbers for low SES kids.

So are we now in agreement that the UC change will not hurt the admission chances of low SES kids, while greatly benefitting the admission chances of high SES kids? Because up until now that has been your main cause for concern.

mtmind: these are your thoughts and opinion, NOT mine, “…the UC change will not hurt the admission chances of low SES kids, while greatly benefitting the admission chances of high SES kids”.

@tlg2023, sorry for the confusion, I meant to direct my question to @CTDad-classof2022 who agreed “+1000000” with your post. Yet he has repeatedly claimed that that the inevitable result of test optional/blind would be smaller numbers of low SES kids, whereas you seem to be suggesting that the increasing number of low SES kids is independent of the test policy altogether.

As to your post, I agree with you regarding the goal of these institutions, but would suggest that the Test Optional/Blind policies have served this goal by (among other things) increasing the pool of adequately prepared applicants from the targeted groups.

1 Like