There seems to be a lot of confusion caused by not paying close attention to attendance rates not controlled for test scores versus attendance rates controlled for very high test scores.
If you are just looking at attendance rates, at Ivy+ colleges they simply go up with income. A lot. Meaning a much higher percentage of children of middle-income families attend an Ivy+ than children of lower-income families. Upper-middle-income families attend at a higher rate than lower-middle-income families, and then upper-income families attend at higher rates still.
If you control for very high test scores, things are less linear. But that’s not a contradiction, because a much smaller percentage of children from lower-income families get very high test scores.
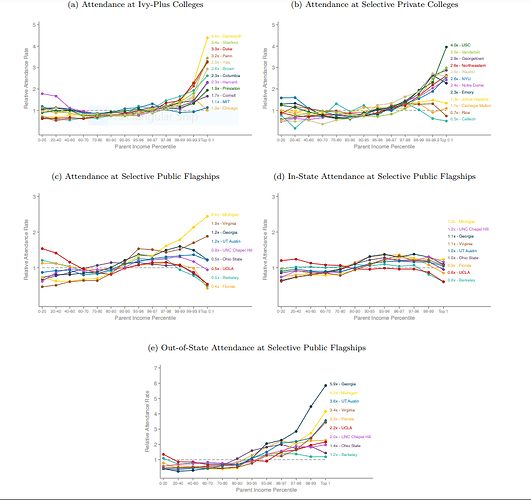
Even so, here is what it looks like when you control for very high test scores:
There is no consistent pattern among the Ivy+ through about the 70-80th decile–some go down a bit, some up a bit, and some are flat. To the extent we can say something generally, I think it would be there is more variance at the lowest incomes between Ivy+. By the time they get to 70-80, they are much more bunched up.
And again, actual attendance is always going up, this is just reflecting what happens when you control for very high test scores and therefore isolate the much smaller pool of lower-income children with very high test scores. Among that small pool, there is a lot of variance.
OK, then the general trend starting above the 70-80th decile is up–and this again is controlling for high test score!
OK, then in the top 2% or so, at most Ivy+, there is a big explosion of attendance rates, even controlled for very high test scores! Chicago and MIT are kinda exceptions, but that’s it.
OK, so how are Ivy+ different from other highly selective colleges? Well, they are not really very different from other highly selective private colleges–see (b). A few more don’t explode in the top 2%, but otherwise it is the same sort of curve.
How about highly selective publics? Well, out-of-state once again looks very similar–see (e). But in-state, there is finally a change–instead of exploding in the top 2%, it actually goes down. See (d).
OK, so what do we know? First, again, attendance not controlled for test scores goes up with income at all these selective privates and out-of-state publics.
Second, attendance controlled for test scores has no consistent pattern from 0-20 through 70-80, but there is more variance among these colleges among the small pool of lower-income people with very high test scores.
Third, at most places, attendance controlled for test scores goes up from 80-99.
But finally, at most places, attendance controlled for test scores explodes among the top 2% at Ivy+, other highly selective privates, and highly selective publics out of state. And that is apparently coming at the cost of top 2% attendance at in-state publics.
So where do middle-income high-achievers go? All these places.
But the upper-middle are doing a bit better than the lower-middle, controlling for very high test scores. And even more so if you don’t control for very high test scores.
