Arcidiacono fails to address the scenario to which I repeatedly refer - otherwise identically situated students - by failing to account for other relevant factors beyond ALDC and supposed “academic” factors. One such factor is geography. Unhooked kids (Asian and Non-Asian) from areas with an overabundance of highly academically qualified kids face a much different admissions landscape than do unhooked kids from other areas, and Asian students tend to be highly concentrated in areas with an overabundance of academically qualified kids. Arcidiacono ignores this and numerous other factors beyond ALDC, and thus fails to provide much insight into my question:
Does an unhooked “Asian” applicant really have a “tougher time” in admissions as compared to an otherwise identically situated unhooked “white” applicant?
Same high school, same intended major, same interests, same rigor, same gender, same everything.
With regard to “Chance Me” threads, that is what some parents seem to think. But Arcidiacono doesn’t address it.
So…if I understand you correctly, in order to make wealthy Asian families less distrustful of T10 admissions policies, a Pell grant recipient or lower-middle class student who happens to be Black would have to match their kids score for score, test for test, objective criterion by objective criterion - before being offered admission. You really want to defend that stance?
I think you’re not comparing apples to apples. The scenario you raised is a socio-economic criteria.
For example, is the poor Asian student judged the same as a poor URM with the same SAT, GPA, etc.
There was some statistic that 90% of free lunch kids at Stuyvesant high school were Asian but they were still seen as having some kind of “unfair advantage” in the admissions test.
Is the upper middle class/affluent Asian student judged the same as others?
Because it makes them money. The examples that I personally know of from this counseling industry are pretty nefarious. The counselors have connections to professors and researchers and pay them (it’s the parents’ money) to give internships and research positions to high schoolers (as a researcher in the Bay Area I have also been approached and kindly refused for both moral and practical reasons). The one student I know personally, whose parents and counselor did this (alongside organizing all others aspects of his high school career, math camps, music competitions, clubs, classes etc. etc.) did not need all this. He is a very bright and personable young man. But he did get the coveted (in his family’s view) top 10 ED acceptance. He’s a little lost now because he’s gone from having 100% of his life organized for him to being unmoored. He’ll do fine because he’s a great person. I chance a guess however that the person he presented on his application is far from who he is. And how can a kid figure out who they are in this manner?
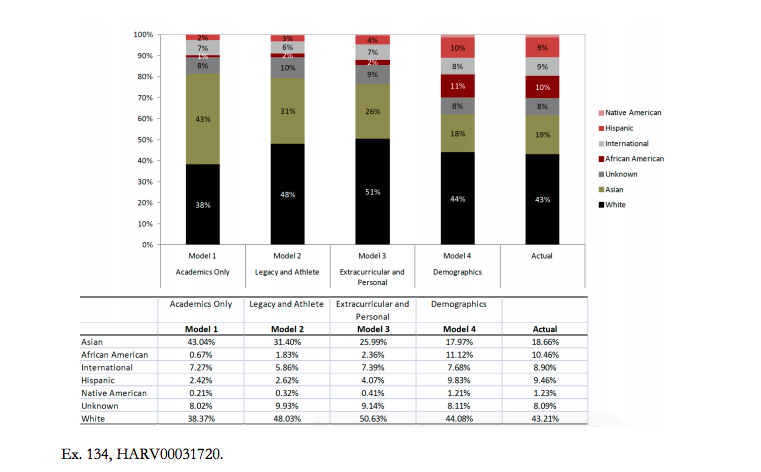
This is a chart that was developed by Harvard’s Office of Institutional Research to describe various admissions models, ranging from pure academic merit on one end, to putting a thumb on the scale for demographics at the other end.
When this exhibit became public, Harvard disavowed it, saying it didn’t represent reality. Note however, that the final model does closely resemble Harvard’s actual admitted class at the time.
Model 1: Considers academics only. Asians would be 43% of the admitted class
Model 2: Hooks for legacy and athletes. Asians would be 31% of the class.
Model 3: Extracurricular and Personal: Asians would be 26% of the class. Note that it was in this section that Asians were given a lower personality score
Model 4: Considers demographics, which include race, and likely family income and location. Asians are at 18%
Actual: Asians are at 19%. All the other groups closely approximate Model 4 as well
Note that Harvard admissions has considerably changed since Harvard created this, with Asians now comprising 27% of the most recent class. It’s not realistic to think that the capabilities of the Asian students applying have changed that much in a short time. Rather, the lawsuit had its intended effect.
Harvard didn’t have to “disavow” the old Office of Institutional Report, because the report itself acknowledged that it was a basic and preliminary analysis that (like with Arcidiacono’s analysis) failed to account for crucial non “academic” admissions factors. In other words, even by its own terms, the Report suffers from the same methodical limitations as Arcidiacono’s analysis.
As for your oft repeated assertion that the Harvard lawsuit achieved its intended result, I think there is an obvious correlation vs causation issue, and I’m not even sure correlation supports your claim. Here is a look back at Harvard admissions over the past 15 years:
In 2007-2008 (15 years ago) 15.5% of Harvard undergrads were Asian-American.
In 2012-2013 (10 years ago) 18.9% of Harvard undergrads were Asian-American.
In 2017-2018) (5 years ago) 20.7% of Harvard undergrads were Asian-American.
Last year’s CDS shows 22.8% of Harvard undergrads were Asian-American.
Over the past two years, when Harvard became test optional and saw a 50% increase in applications, the Asian-American representation of those admitted has increased to over 27%.
That looks to me like incremental change over time, not sudden change that may or may not have been in response to the 2017 lawsuit.
That’s a good question, but before you even get there, the threshold question would be, how heavily recruited was each of them? For example, does Harvard even bother sending recruiters to Stuyvesant these days? When I was recruiting for Wesleyan many moons ago there were many a college fair or “College Night” when HYP were virtual no-shows, ostensibly because they felt they already had a high profile in certain NYC neighborhoods.
I guess we can always criticize a study because its conclusions differ from our opinion/world view by picking parameters that the study did not address. Sure there are many factors that go into the admissions decisions of any highly rejective college. I guess we can try to narrow down the hypothetical to what if we have 2 applicants from the same high school who are identical in everything but race and ask if race affects their chances. There would not be enough data to support any conclusion there.
Agree that geography is a factor; in fact it came out that Harvard considers “sparse country” applicants as a factor. But you come to a conclusion without supporting data that Asian students come from concentrated areas and that is why their admissions rates are lower. Not a wild supposition, but it is also not a wild supposition that White nonALDC applicants in the top 3 AI deciles also are overrepresented in certain geographic regions, yet their chances for admissions are about 20% to 50% higher than nonALDC Asian Americans.
Looking at another table, the lower Asian admit rate probably has more to do with the number of high AI Asian American applicants than geography. Over 47% of Asian American applicants were in the top 3 deciles compared to just under 30% for White nonALDC. So while I do not think that being Asian American is a direct negative, the fact that those students to some extent are being compared against other Asian Americans that on average are high performers, they are at a disadvantage in a zero sum game
Hold up here. I’m not criticizing the Arcidiacono analysis “because its conclusions differ from [my] opinion/world view.” I am criticizing the analysis because it does not address whether an unhooked “Asian” applicant really has a “tougher time” in admissions as compared to an otherwise identically situated unhooked “white” applicant. When it comes to advising Asian and non-Asian students on “Chance Me” threads, that is a key and recurring question.
Do I really need to provide you data that Asian populations are generally concentrated certain areas, or that these areas also happen to be areas with a higher concentration of exceptionally qualified students? Because while such data exists, I think you already know that this is the case.
I don’t follow? White nonALDC applicants are overrepresented in certain geographic regions, but this is one of the factors which the Arcidiacono report fails to address. “Sparse country” is generally where “Asian” Americans are underrepresented and “white” Americans are overrepresented. Here are the ten states with the highest percentage of “white” people:
My point was if we assume high performing Asian Americans are concentrated in certain geographic areas and that is why their admissions rates are lower, then it is also reasonable to assume that high performing Whites (we are focused on the top 3 deciles) are also geographically concentrated. Yet NonALDC Whites still have much higher acceptance rates.
Along this line of reasoning, I wonder whether it might actually hurt an Asian to score 1600 on the SAT or 36 across the board on the ACT in a single/one-and-done sitting because, instead of being impressed, AOs might think that the student must have over-prepared and be turned off as a result.
But you are equating the admissions rates for all “NonALDC whites” with the admissions rates for “high performing whites” in areas with a high concentration of high performing students, and the Arcidiacono data doesn’t support this. The data from “sparse country” (among other things) distorts the overall rate for “NonALDC whites,” and thus isn’t representative of the rate in highly competitive regions.
No, I am not. I was comparing admissions rates for the top 3 AI deciles of non ALDC Whites and non ALDC Asian Americans. “For the top 3 AI deciles, the admit rates for non ALDC White are 7.53; 10.77 and 15.27 vs 5.12; 7.55; and 12.69 for non ALDC Asian Americans.” For like performing high academic achievers, the non ALDC White applicants had respectively a 47%, 43% and 20% higher admissions rate. While not purely apples to apples, the comparison is IMO a fair one that does address to at least some extent geographic concentration. As I mentioned later in one of my post, I think the driving reason why the non ALDC Asian American rates are lower has less to do with geography and more to do with the fact that 47% (19,074±) of non ALDC Asian Americans (out of 40,308 applicants) are in the top 3 deciles while only 30% (17,160 ±) non ALDC White applicants (out of 57,451 applicants) are in the top 3 deciles.
The thread has strayed far from the OP’s intent, which I guess is not surprising. But I will ask users to move on from any Arcidiacono analysis, particularly since there have been previous threads on this topic where many of the same people have already debated to death.
I hope that the above is not true. However, I do know that at least at my daughter’s school, the perfect stats kids did not always do as well as they expected especially in comparison to their lower stat peers. To be very clear, I am aware that I am offering anecdote not data. But here is my experience:
In general, my daughter’s college prep high school does very well in helping their students land in excellent colleges across all races and socioeconomic statuses. They send a lot of students to the colleges discussed here. I am most aware of the last 2 admissions cycles since my daughter was a senior last year. During those years, unhooked wealthy/upper middle-class Asian-American applicants seemed to have about the same success with admissions to highly selective (or rather highly rejective as people on CC like to call them) colleges and universities as their white (unhooked) applicants counterparts did and slightly worse outcomes than the small handful of her unhooked but wealthy Black and Latino classmates (there just weren’t many such black and latino kids). However, there were fewer legacy students and athletes among her Asian-American friends than among her white friends.
The low-income and working class Asian-American students did not have worse outcomes than their peers of other races. They were not perfect stat kids yet many received acceptances to colleges where as an applicant, they likely fell on the less accomplished end of the accepted pool if you were only looking at stats. To put it more plainly, despite having weaker SAT scores and grades than many of their wealthier classmates, they did quite well in admissions. This was particularly true for students who applied to highly selective small liberal arts colleges, but there were also some “surprises” at the elite larger universities among these students. I put surprises in quotes because I think those were only surprises based on stats --knowing some of my daughter’s friends, it did not seem at all surprising given how fantastic those kids were and how far they had come from their under resourced middle schools to be in the top half of their prep school class --but often not the very top of the class.
In some ways, I find this trend a bit predictable because I think a lot of elite colleges like to admit FGLI kids who went to prep school because they think college will be less of a culture shock to those kids. And cynically perhaps, it lets the college serve its diversity goals while not taking much of a risk. They know my daughter’s school and the strength of its graduates. For that reason, I am quite hesitant to generalize beyond my daughter’s classmates. The prep school crowd is small, elite and self-selected/filtered even before they apply to college. The college advisors do their jobs in helping kids find a way to tell their stories and put lower grades in context.
All of that said, in my daughter’s experience, the stats of students at her school could be predicted fairly well by the type of middle schools they attended and whether or not they were sponsored by a sending organization like A Better Chance. Despite lower stats, the Asian-American students who were coming from under resourced middle schools (compared to majority of her classmates) and such organizations, had similar profiles and college acceptance rates as other BIPOC students coming from those middle schools.
Never going to be able to prove or disprove without “smoking gun” evidence. Anecdotes even from AOs don’t count. Statistics aren’t granular enough.
Moving on, is it such a bad thing that Asian American students are looking for that thing that will distinguish them? And for that highly ranked college that doesn’t yet have “too many Asians”?
If it’s not fencing/tennis/squash/music/science/math - maybe this is a good thing that kids are looking for ways to be different.
In light of the original OP, do you know whether your child considers themselves Asian, Asian American, American or something else?
I agree that perfect scoring SATs should be congratulated not seen suspiciously. I’ve seen a number of commenters on CC telling kids to retake mid-1500s because they’re Asian and that’s not good enough and it makes me want to scream.
As a CC community I think we should start pushing back. I don’t know how but I appreciate this thread and everyone’s thoughts.